Data science has recently emerged as an interdisciplinary field with a fair amount of hype around it. It has been declared as the sexiest job of the 21st century and the salaries of data scientists have skyrocketed. However, there still is not a good overall definition for data science, so here I’ll try to open it from my own perspective.
An obvious reason to the lack of a good definition is that professionals from a diverse set of fields, such as analytics, statistics, computer science, business intelligence and information management, jumped to adopt to new sexy job title, and everyone emphasizes her own background in her definitions.
A good way to approach the problem is to list skills that are necessary for the job, or at least common among data scientists. An often cited combination of skills is illustrated by Drew Convay in the Data Science Venn Diagram:
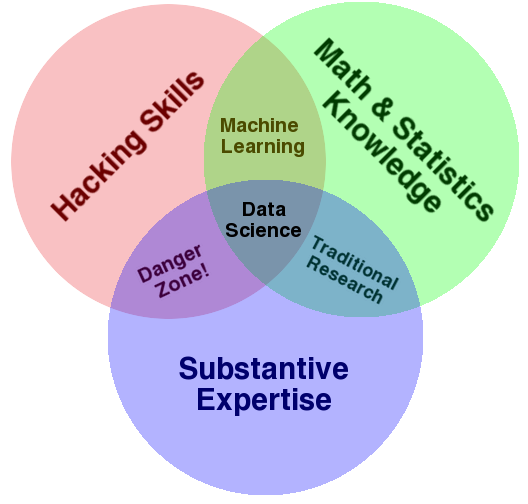
Personally I think this is a very good starting point. Math and statistics knowledge is required to know how and why different statistical data analysis methods work, and importantly, when they do not work (see the Danger Zone in the Venn Diagram)! At least basic programming skills (e.g. R or Python) are practically a must in processing and analyzing large and messy data sets. And to be able to really connect the data analysis to the business problems and create value, also substantive expertise is needed.
One could argue that this combination is nothing new, as data analysts and statisticians have been doing this stuff for decades in both research and business. For example, the data science rockstar Nate Silver claimed that data scientist is just a sexed up word for a statistician. However, I think the challenges set by the variety and messiness of practical data analysis problems today are different from what statistics has traditionally been dealing with. Hadley Wickham had a very nice post about this.
In my opinion there’s one important skillset missing in the Venn Diagram, which is communication. Without proper communication skills even the greatest of results will not be taken into use. An essential part of communication is information visualization, which is used to illustrate complex statistical phenomena in understandable terms. A data scientist is also a consultant with a need for some soft skills as well.
Recently I bumped into the definition of a modern data scientist, which indeed adds the communication piece in the puzzle. This new defition is neatly summarized in the following figure:

Notice how Big Data -related tools, such as MapReduce and Hadoop, are also mentioned in this definition, but only in a somewhat minor role. This is in line with my own view, as I see that there’s no value in the amount of data as such, and that there’s plenty of interesting things to do with small data sets as well. But more about Big Data in some future post. I will also leave for a further position to cover in more detail the different types of problems and tasks a data scientist can engage in.